

Top use cases
Build an interactive chart
Pick a template and turn your data into a chart for a website.
Tell a data story
Create a multi-step explainer with charts and captions.
Update charts from a sheet
Keep a published chart current with live data from Google Sheets or CSV on the Publisher plan.
Flourish FAQs
What is Flourish?
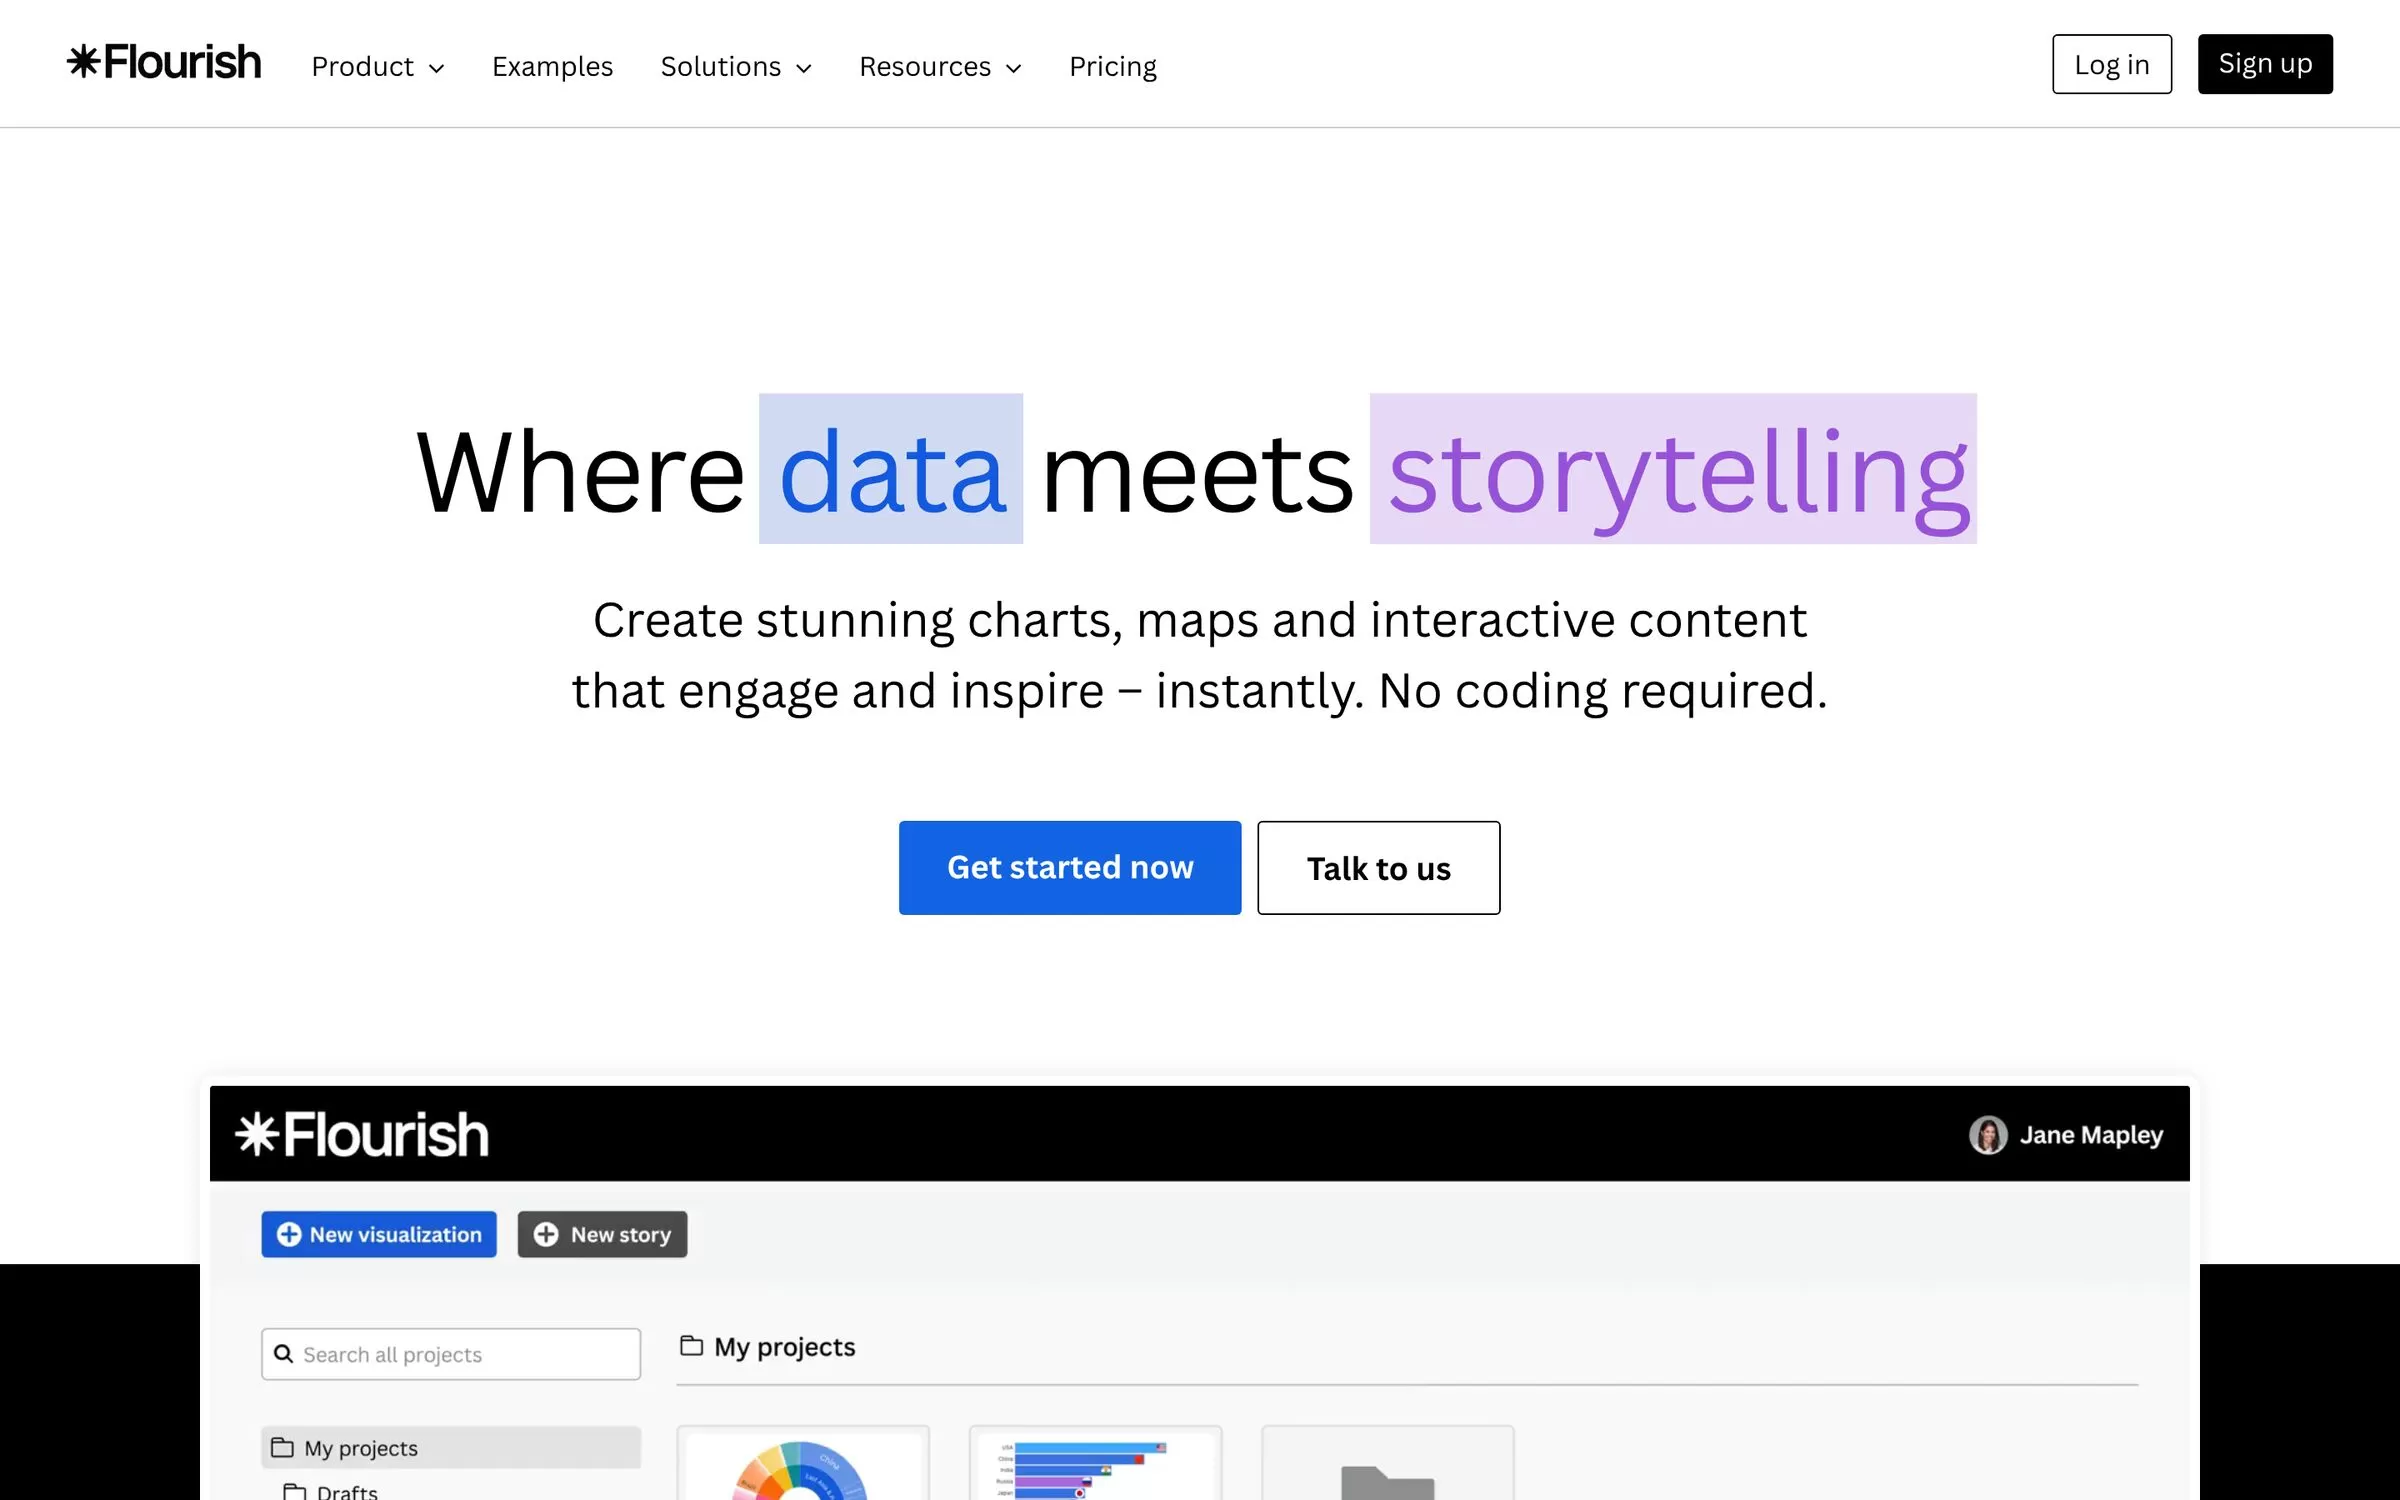
Flourish creates interactive charts, maps and data stories with no-code templates. Flourish lets you build interactive charts and maps from ready-made templates, with no coding. You can also combine them into data stories and refine charts with its AI assistant.
Is Flourish free?
Yes, Flourish has a free plan: unlimited projects with public publishing.
How much does Flourish cost in India?
Flourish lists its current plans on its website, flourish.studio.
What is Flourish best for?
Flourish is best for newsrooms, marketing and professional teams. People use it to build an interactive chart, tell a data story and update charts from a sheet.
How to build an interactive chart with Flourish?
With Flourish, you can pick a template and turn your data into a chart for a website.
How to tell a data story with Flourish?
With Flourish, you can create a multi-step explainer with charts and captions.
How to update charts from a sheet with Flourish?
With Flourish, you can keep a published chart current with live data from Google Sheets or CSV on the Publisher plan.
What are the best Flourish alternatives?
Popular alternatives in Data Analysis include Datawrapper, Deepnote, Displayr and Google Colab. Each has its own free plan and price, so compare them on the tool pages.
Where can I sign up for Flourish?
On its official website, flourish.studio. You can start on the free plan.
When were Flourish's price and features last checked?
We checked them on the official site on 30 October 2026. Plans change often, so confirm the latest price on flourish.studio before you pay.