Synopsis: Usha Martin Ltdhas formed an ascending triangle on the 1-week chart, signalling a possible short-term bullish breakout.
A flat resistance line and higher lows characterise an ascending triangle, a bullish continuation pattern. The chart shows a bullish breakout above the key resistance zone near Rs 497, supported by strong buying momentum and rising volumes.
On Wednesday, Usha Martin Limited broke above the key resistance level of Rs 497 and held there, transforming it into a strong support zone. On the weekly chart, the stock closed at Rs 510.45, indicating that bullish momentum has continued and buying interest has strengthened.
In an ascending triangle pattern, traders typically target the next resistance level or project a price move equal to the triangle’s height from the breakout point, while strong buying volume and positive momentum help confirm the bullish breakout.
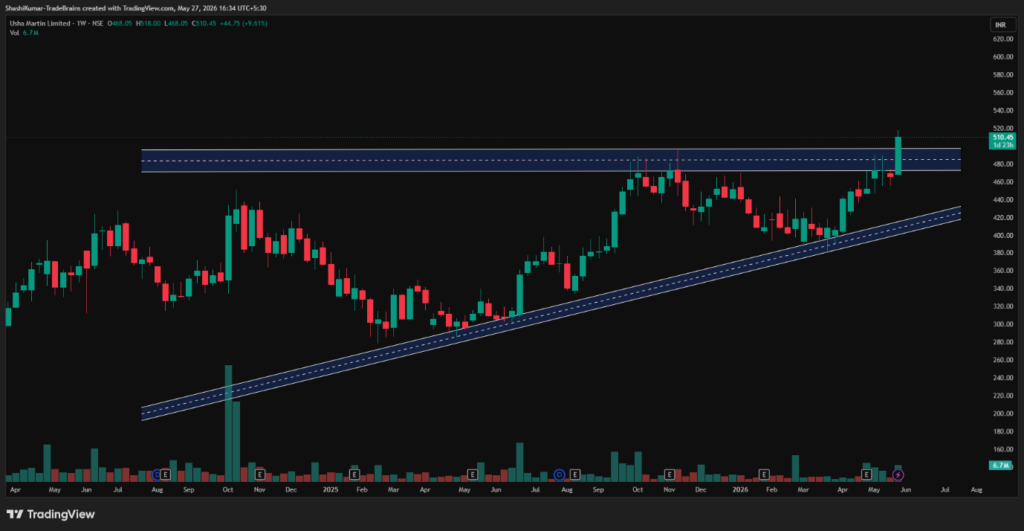
Usha Martin Ltd Chart: 1-week Timeframe
Indicator Confirmation
- RSI: The weekly RSI indicates buying pressure, as it rose from 62.73 in the previous week’s trading session to 72.17 on Wednesday, which is considered an overbought zone.
- Price Volume Trend: The Price Volume Indicator confirms the uptrend, accompanied by an increase in buying volume in the weekly time frame.
- MACD: On the weekly time frame, the blue MACD line was above the orange signal line, with the histogram turning green, indicating bullish momentum.
- Moving Averages: On the weekly time frame, the 5-day EMA was above the 9-day EMA, further confirming a bullish trend.
Implications
The ascending triangle pattern indicates continued upside potential. Sustaining above the Rs 497 support level, along with strong trading volumes, could further strengthen the near-term bullish outlook.
About the stock
Usha Martin Limited is a leading Indian multinational company specialising in speciality steel wire ropes, wires, and related engineering solutions. Headquartered in Kolkata, the company serves industries such as mining, infrastructure, offshore, elevators, and construction. With manufacturing facilities across India and international operations in multiple countries, Usha Martin is known for its high-performance wire rope products, strong global presence, and advanced engineering capabilities.
Usha Martin Limited has shown strong bullish momentum, gaining 11.19% over the past month. The stock has also surged 21.48% in the last six months and delivered a strong 61.57% return on a year-over-year basis. For more such technical stock ideas, click hereto view our research page.
Disclaimer: The views and investment tips expressed by investment experts/broking houses/rating agencies on tradebrains.in are their own, and not that of the website or its management. Investing in equities poses a risk of financial losses. Investors must therefore exercise due caution while investing or trading in stocks. Trade Brains Technologies Private Limited or the author are not liable for any losses caused as a result of the decision based on this article. Please consult your investment advisor before investing.
The post Usha Martin Forms An Ascending Triangle Pattern Signalling At A Short-Term Bullish Breakout appeared first on Trade Brains.
Original Article
(Disclaimer – This post is auto-fetched from publicly available RSS feeds. Original source: Tradebrains. All rights belong to the respective publisher.)