Synopsis: Adani Enterprises Ltd has formed an ascending triangle on the 30-min chart, signalling a possible short-term bullish breakout.
An ascending triangle is a bullish continuation pattern marked by higher lows and a flat resistance line. The chart shows a confirmed bullish breakout above horizontal resistance. Supported by volume surge. On Tuesday, Adani Enterprises Ltd broke the resistance neckline and sustained above the Rs 2,336 level, which is now acting as a support zone in the 30-min. chart.
In an ascending triangle, traders typically target the nearest resistance level or project a price move equal to the triangle’s height from the breakout point, using strong volume and momentum to confirm the trade.
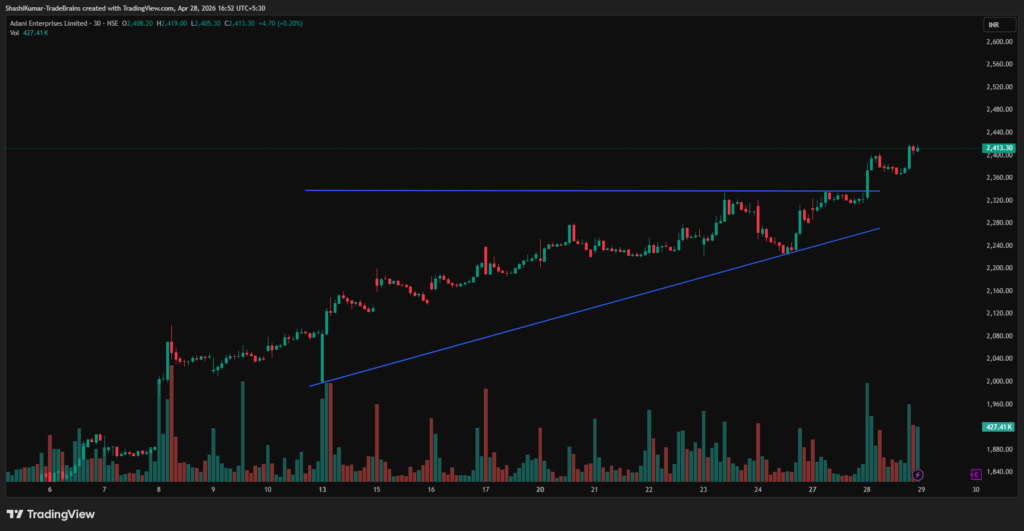
Adani Enterprises Ltd Chart: 30-min Timeframe
Indicator Confirmation
- RSI: The daily RSI indicates bullish momentum, as it rose from 71.90 in the previous trading session to 76.44 on Tuesday.
- MACD: On the daily time frame, the blue MACD line was above the orange signal line, with the histogram turning green, indicating bullish momentum.
- Moving Averages: On the daily time frame, the 5-day moving average was above the 9-day moving average, further confirming a bullish trend.
- Price Volume Trend: The Price Volume Indicator confirms the uptrend, accompanied by a sharp increase in buying volume in the daily time frame.
Implications
The ascending triangle pattern indicates continued upside potential. Maintaining levels above the Rs 2,336 support mark, especially with strong trading volumes, would further strengthen the near-term bullish outlook.
About the stock
Adani Enterprises Limited is the flagship company of Adani Group, one of India’s largest business organisations. Over the years, Adani Enterprises has focused on building emerging infrastructure businesses, contributing to nation-building and divesting them into separate listed entities. Having successfully built sizeable and scalable businesses like Adani Ports & SEZ, Adani Energy Solutions, Adani Power, Adani Green Energy, Adani Total Gas and Adani Wilmar, the company has contributed to making India self-reliant with our robust businesses.
Over the past month, Adani Enterprises Ltd has risen 37.31%. Despite this short-term gain, the stock is down 0.14% over the past six months and has delivered a 5.11% increase year over year. For more such technical stock ideas, click hereto view our research page.
Disclaimer: The views and investment tips expressed by investment experts/broking houses/rating agencies on tradebrains.in are their own, and not that of the website or its management. Investing in equities poses a risk of financial losses. Investors must therefore exercise due caution while investing or trading in stocks. Trade Brains Technologies Private Limited or the author are not liable for any losses caused as a result of the decision based on this article. Please consult your investment advisor before investing.
The post Adani Enterprises Forms An Ascending Triangle Pattern Hinting At A Short-Term Bullish Breakout appeared first on Trade Brains.
Original Article
(Disclaimer – This post is auto-fetched from publicly available RSS feeds. Original source: Tradebrains. All rights belong to the respective publisher.)