AI is the most disruptive force in the field of application performance monitoring today, since milliseconds stand between customer satisfaction and its competitive advantage in a hyper-connected world. Such AI-enhanced applications go beyond the conventional approach of monitoring—they use ML algorithms to predict performance issues long before they have any user impact, perform real-time correlation of vast amounts of data, and finally render intelligent root cause analysis that turns reactive troubleshooting into proactive optimization. AI tools will capitalize on the opportunity to monitor by analyzing historical data patterns against user behavior for anomaly detection, identifying performance bottlenecks within complex microservices architectures.
| Tool | AI Capabilities | Deployment Model | Integration Ease | Best For Business Size |
|---|---|---|---|---|
| Dynatrace | Anomaly detection, root cause, auto-remediation | Cloud, On-prem, Hybrid | Seamless with cloud-native & multicloud | Medium to Large Enterprises |
| Datadog | ML for anomaly detection, auto alerts | SaaS | 400+ integrations | All Sizes (scales well) |
| New Relic | AI anomaly detection, AIOps | Cloud, Hybrid | 775+ integrations | Medium to Large Enterprises |
| AppDynamics | Auto baseline, anomaly detection, business transaction mapping | Cloud, Hybrid, On-prem | Good, but initial setup complex | Large Enterprises |
| SolarWinds APM | AI-enhanced alerts and templates | On-prem, Cloud, Hybrid | Decent, but limited third-party tools | Small to Mid-size Businesses |
| Fiddler AI | Model drift, explainability, root cause | Cloud, On-prem | MLOps pipeline ready | Data Science/ML Teams |
| Quantum Metric | Real-time AI for journey friction | SaaS | Data warehouse & mobile SDKs | Mid to Large Enterprises |
| Raygun | Error prediction, user monitoring | Cloud | Strong dev tool integration | SMBs to Mid-size Dev Teams |
| Site24x7 | AI-driven anomaly alerts | Cloud, Hybrid, On-prem | All-in-one platform | SMBs to Enterprises |
| Uptrace | Anomaly detection via OpenTelemetry | Self-hosted or SaaS | Open-source friendly | Tech-savvy, cost-conscious teams |
Dynatrace
| WEBSITE | www.dynatrace.com |
|---|---|
| Rating | 4.2 |
| Free Trial | Yes |
| Best For | Enterprise teams needing AI-powered full-stack observability, performance, and security monitoring. |

Dynatrace is, in fact, an AI-driven application performance monitoring solution that changes the game in this age of rapid digital innovation. This sophisticated machine learning capability automatically discovers application dependencies and tracks transactions across the entire stack, delivering real-time actionable insight. Moreover, its AI engine, Davis, proactively detects anomalies, assigns root causes, and performs or automates remediation to ensure that users remain less aware of incidents and at optimal levels of their experiences. Adding to that, Dynatrace integrates seamlessly across environments, such as cloud-native, hybrid, and multi-cloud. Organizations can visualize user journeys, optimize resource allocation, and guarantee enterprise-grade reliability. In the end, organizations benefit from a holistic supervisory framework that speeds up incident response.
Pros
- Complete observability on applications, infrastructure, and user experience.
- Seamless integration to the multicloud and cloud-native environments.
- Real-time dashboards and customizable analytics
Cons
- Pricing can be higher for small teams
- Some users report a learning curve
Pricing
| Plan | Pricing |
|---|---|
| Full Stack Monitoring | $0.08 / hour (8 GiB Host) |
| Infrastructure Monitoring | $0.04 / hour (any size Host) |
| Kubernetes Platform Monitoring | $0.002 / hour (any size Pod) |
| Application Security | $0.018 / hour (8 GiB Host) |
| Real User Monitoring | $0.00225 / session |
| Synthetic Monitoring | $0.001 / synthetic request |
| Log Management & Analytics | $0.20 / GiB |
Datadog
| WEBSITE | www.datadoghq.com |
|---|---|
| Rating | 4.2 |
| Free Trial | Yes |
| Best For | Enterprise teams needing AI-powered full-stack observability and real‑time monitoring. |
Datadog brings cloud-native and hybrid metrics, traces, and logs into a single view to allow real-time, relevant insights to get teams to notice anomalies, trace causes, and adjust user experience before a major issue develops. Machine learning algorithms exist to flag performance bottlenecks before they become intolerable. Still, they can do more than that. Users build custom dashboards or choose from over 400 integrations to see more deeply into each layer of their stack. From setting up alerts automatically to distributed tracing or synthetic monitoring, Datadog has disrupted the traditional reactive way of troubleshooting to one of proactive optimization, thus enabling companies to cut downtime, spur innovation.
Pros
- Highly customizable dashboards and alerts
- Suitable for scalability in businesses of all sizes
- Log and trace analysis in real-time
Cons
- Pricing can skyrocket once you scale
- Some users report thin support for front-end integration.
Pricing
| Plan | Pricing |
|---|---|
| Pro | $15 / host / month |
| Enterprise | $23 / host / month |
| DevSecOps Pro | $22 / host / month |
| DevSecOps Enterprise | $34 / host / month |
 StartupTalkyRishi Mundra
New Relic
| WEBSITE | www.newrelic.com |
|---|---|
| Rating | 4.2 |
| Free Trial | Yes |
| Best For | Enterprise teams needing AI-enhanced full-stack observability, real-time monitoring, and AIOps. |
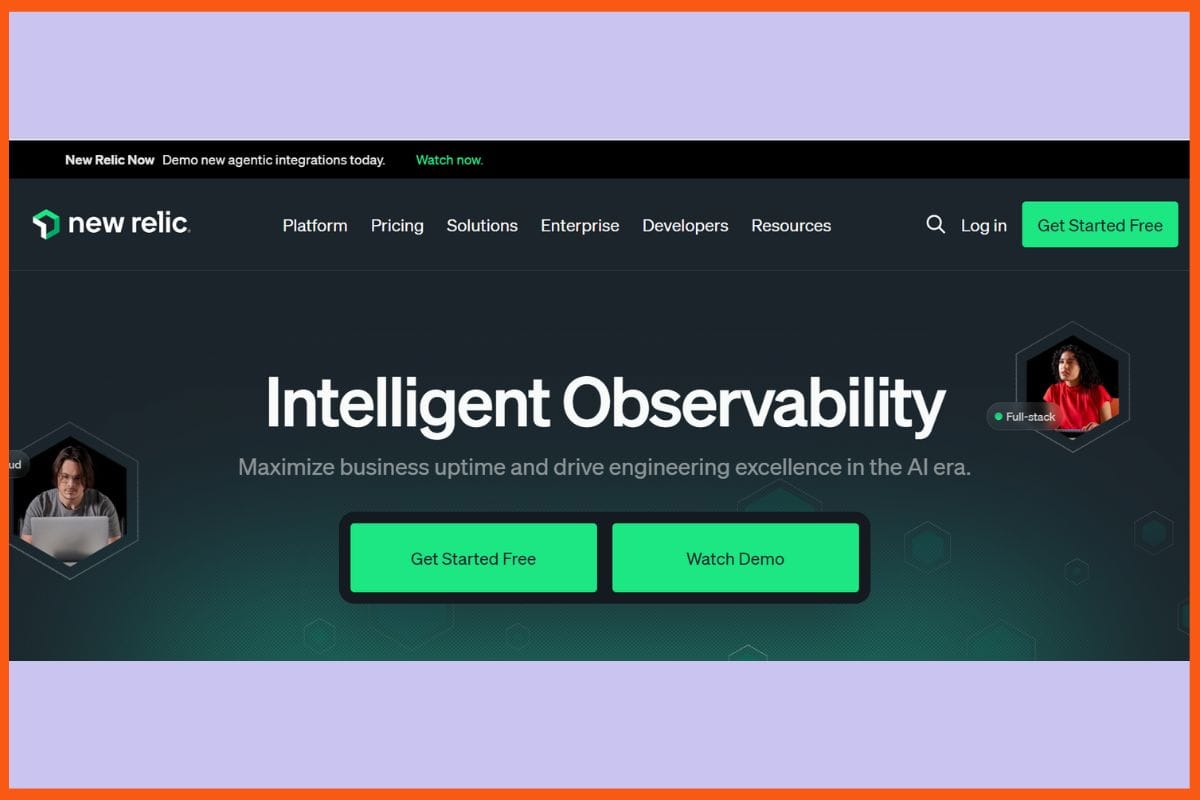
Amidst digital transformation, New Relic reinvents application performance monitoring via an AI-based engine with end-to-end observability and actionable intelligence. To enable teams to pinpoint anomalies, optimize spend, and remediate issues before they reach the user, New Relic provides unification of metrics, traces, and logs across the entire stack of AI models, microservices, and databases. The intelligent monitoring provides real-time observability into every layer, from prompt to response, through deep trace analysis, model comparison, and cost tracking. Instantaneous integrations, customizable dashboards, and automated alerts facilitate swift troubleshooting and allow for continual optimization; hence, New Relic becomes an almost irreplaceable partner for any organization wanting to scale up uptime, performance, and user satisfaction.
Pros
- AI-driven anomaly detection and automated root-cause analysis
- thousands of third-party integrations, it is truly innovative (775+ of them)
- Free tier available for small teams
Cons
- Learning curve for some users
- User-based licensing can be a hurdle for large teams
Pricing
New Relic offers custom pricing; contact them for a quote.
AppDynamics
| WEBSITE | www.appdynamics.com |
|---|---|
| Rating | 4.3 |
| Free Trial | Yes |
| Best For | Enterprises seeking deep application performance monitoring, business transaction insights, and end-to-end visibility. |
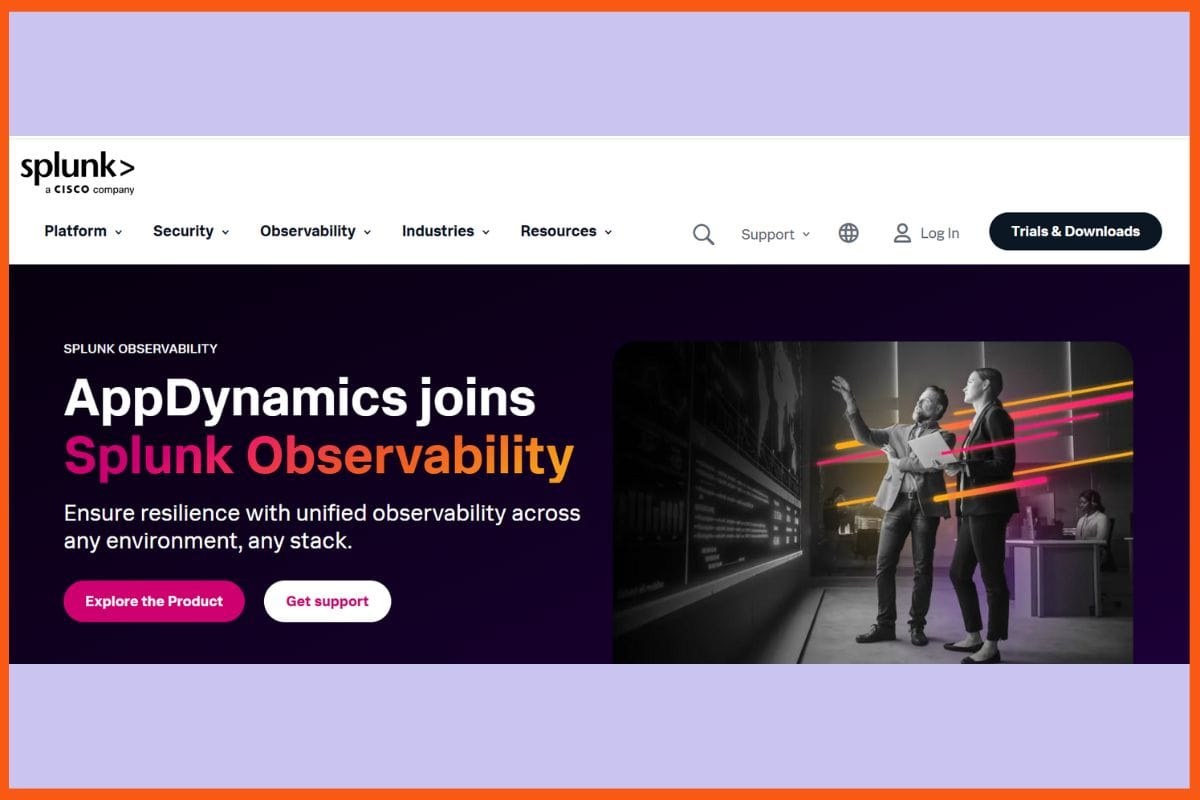
AppDynamics is one of the top AI apps for performance monitoring in such a high-stakes industry because it was purpose-built to provide not just real-time but end-to-end visibility into the entire technology stack. Advanced machine learning underlies Appdynamics automatically discovers application architecture, dynamically baselines performance, and immediately detects anomalies before impacting users. It has intelligent root cause analysis that can pinpoint an issue down to the code level, whereas it relates technical performance to business outcomes through business transaction monitoring. Therefore, AppDynamics enables optimization of user experience, acceleration of troubleshooting, and growth in business through actionable insights and full-stack analytics across the clouds, as well as in-premises and hybrid environments.
Pros
- Real-time, full-spectrum monitoring
- Auto-discovery and mapping of application architecture
- Greatly customizable dashboards
Cons
- Initial configuration and setup can be quite complex
- Alerting may include some shortcomings
Pricing
| Plan | Pricing |
|---|---|
| Premium | $6 / month / CPU core |
SolarWinds APM
| WEBSITE | www.solarwinds.com/products/apm |
|---|---|
| Rating | 4.1 |
| Free Trial | Yes |
| Best For | Small to mid-sized businesses and hybrid IT teams that want affordable, full-stack observability, easy setup, and customizable alerts. |
Count it as a boon for SolarWinds APM, which is armed with AI-enhanced capabilities, to come forth as an astute solution among the most advanced applications designed for performance monitoring-hence ensuring that IT teams gain further insights that are real-time and intelligent into operation status. The advanced monitoring templates, along with intelligent dashboards, allow SolarWinds APM to proactively detect, diagnose, and clear out performance issues across cloud, on-premises, and hybrid environments. It automates application dependency mapping while adding customizable alerts, thus cross-stack data becomes correlated, ensuring that it is visible and possible to manage even the most complex infrastructures. Intuitive reporting and proactive anomaly detection form part of an advancement toward supporting modern cloud-native architectures.
Pros
- Anomaly detection and alerting in real time
- Polling engine for large environments and better performance scalability
- Flexible pricing for SMBs
Cons
- Limitations in third-party tool integrations
- Some users claim support response times are slow.
Pricing
| Plan | Pricing |
|---|---|
| Monitoring Observability | $6 / node / month |
| Database | $117 / database / month |
| Service Management | $39 / technician / month |
| Incident Response | $9 / user / month |
 StartupTalkyRishi Mundra
Fiddler AI
| WEBSITE | www.fiddler.ai |
|---|---|
| Rating | 4.0 |
| Free Trial | Yes |
| Best For | Organizations building, deploying, and monitoring ML/LLM models with a need for explainability, drift detection, governance, and responsible AI observability. |

Fiddler AI focuses on transparency, explainability, and actionable insights. Fiddler AI allows a team to proactively sense that drifts in the model, data quality issues, as well as performance anomalies, cross all types, including structured and unstructured data like NLP and computer vision models. Real-time alerts, root cause analysis, and very deep model explanations are all packed into a unified dashboard, allowing an organization to address problems before they translate into user detriment or pain to business KPIs. Additionally, the tool is seamlessly integrated into existing pipelines in MLOps, available in the cloud or on-premise, and advanced analytics change reactive troubleshooting into proactive optimization within organizations.
Pros
- Both ML and LLM models can be powerfully monitored
- Unified access to actionable insights and root cause analysis
- Very clean and easy interface to track issues and data points.
Cons
- Some advanced features may require technical expertise
- Dashboard customization is slightly complex
Pricing
Fiddler AI offers custom pricing; contact them for a quote.
Quantum Metric
| WEBSITE | www.quantummetric.com |
|---|---|
| Rating | 4.6 |
| Free Trial | No |
| Best For | Enterprise digital teams needing real‑time session replay, friction detection, journey analytics, and AI‑powered insights for customer experience optimization. |

Quantum Metric is redefining what app performance monitoring is all about with an AI-backed real-time user journey insight and operational intelligence integrated into an analytics solution. It's a patented session replay and behavioral analytics enable teams to surface friction points instantly, measure business impact, and resolve the issues before they touch end-users. Felix AI from Quantum Metric thus reduces the often complex cross-device user behavior into a bite-sized, actionable summary within its platform. Advanced segmentation, funnel analysis, and custom dashboards further enable deep targeted optimization. The lightweight SDK, robust mobile support, and seamless integration with data warehouses will ensure speed in deployment.
Pros
- Lightweight SDK for rapid deployment with fewer code changes.
- Supports several mobile frameworks like Flutter, React Native, etc.
- Integrates with all database houses and cloud platforms.
Cons
- Pricey, but mainly targeting mid to large enterprises.
- No free trial or free tier.
Pricing
Quantum Metric offers custom pricing; contact them for a quote.
Raygun
| WEBSITE | www.raygun.com |
|---|---|
| Rating | 4.3 |
| Free Trial | Yes |
| Best For | Dev and Ops teams needing integrated crash reporting, real-user monitoring, and APM with AI‑powered error resolution. |
With a laser-like focus on real-user experience and actionable diagnostic insights, Raygun differentiates itself from almost all others. Traditional APMs do not provide instant code-level insight into Frontend and Backend performance. Hence, teams can quickly identify and remediate issues even before the users notice them. Their real-user monitoring (RUM) catches every session and shows bottlenecks and errors with great detail, while Crash Reporting will point to root causes down to the exact line of code. With seamless integrations, customizable dashboards, and quick setup via lightweight SDKs, Raygun distills complex data into prioritized actions, thus the platform of choice for teams wanting both complexities and simplicity in optimizing the digital experience.
Pros
- Deep diagnostics, error tracking, and crash analytics
- Easy integration into the most common tools available (Slack, GitHub, JIRA, etc.)
- Actionable insights
Cons
- Initial installation may prove complicated
- Limitations on customization
Pricing
| Plan | Pricing |
|---|---|
| Basic | $120 / 100k traces / month |
| Team | $240 / 200k traces / month |
| Business | $1200 / 1M traces / month |
| Enterprise | Contact Sales |
Site24x7
| WEBSITE | www.site24x7.com |
|---|---|
| Rating | 4.3 |
| Free Trial | Yes |
| Best For | Small to enterprise IT/DevOps teams needing all‑in‑one monitoring (infrastructure, APM, RUM, logs, network), with global coverage and AI‑driven alerts. |
Site24x7 is an emerging artificial intelligence-powered full-stack application performance monitoring solution. Unlike most of the traditional monitoring tools, Site24x7 combines real user monitoring, synthetic tests, and deep code-level diagnostics into one easy-to-use dashboard over an environment that could either be cloud, hybrid, or on-premise. Its AI-driven detection of anomalous behavior and automated alert further empowers teams to act before the impact of the occurrence on end users, directing tracing as well as application dependency mapping for instantaneous visibility into complicated microservices and infrastructure. Rapid deployments and customizable dashboards, together with affordable and scalable pricing, help to transform performance monitoring from a reactive function into a proactive business-centric term, thus making it uniquely available for organizations.
Pros
- Centralized monitoring for applications
- Lightweight, rapid deployment with intuitive dashboards
- scalable for both SMBs and enterprises
Cons
- Some advanced features may require some technical expertise
- Customizing the dashboards is cumbersome to learn.
Pricing
| Plan | Pricing |
|---|---|
| Professional | $44.03/month |
| Enterprise | $655.17/month |
Uptrace
| WEBSITE | www.uptrace.dev |
|---|---|
| Rating | 4.5 |
| Free Trial | Yes |
| Best For | Teams needing affordable, scalable OpenTelemetry-based APM and full‑stack observability (traces, metrics, logs), either self‑hosted or in the cloud. |
Uptrace innovatively reconceives application performance monitoring for today's modern distributed systems. Uptrace intertwines distributed tracing, metrics, and logs into one easy-to-understand platform, unlike the old APMs through which teams can identify bottlenecks, boost SQL queries, and troubleshoot before customers notice problems. It also provides an in-depth understanding at scale with a negligible penalty by its inherent OpenTelemetry connection, blistering ClickHouse backend, and ingenious anomaly detection. Its architecture as an open-source product, flexible integration options, and transparent usage-based pricing make it one of its types in entering organizations looking for enterprise-level monitoring without vendor lock-in or crippling costs. For engineering teams with actionable intelligence and cost-efficient scalability requirements.
Pros
- Native OpenTelemetry support for seamless integration
- ClickHouse-based analytics for enhanced performance and storage efficiency
- SQL query monitoring with real-time anomaly detection
Cons
- Learning curve for teams unfamiliar with distributed trace or OpenTelemetry.
- No free tier for hosted SaaS, only free trial and open-source.
Pricing
| Plan | Pricing |
|---|---|
| 50GB | $0.080 |
| 3TB | $0.070 |
| 8TB | $0.060 |
| 20TB | $0.050 |
| 50TB | $0.040 |
| 100TB | $0.030 |
| 200TB | $0.025 |
Conclusion
In a digital environment where milliseconds determine the essence of success, AI-based application performance monitoring would serve as the pillar for resilient and user-centric innovations. Based on machine learning, these solutions detect anomalies in real-time, analyze automated roots, and provide prognostic insights for the team's proactive allocation of issue resolution, resource optimization, and seamless experiences at an extensive scale. Bringing complex architectures under one view, personalized dashboards, and smart alerts change remedial troubleshooting into strategic optimization. AI empowerment in monitoring became not only imperative in an advancing world but also mandatory as organizations would now have a sustainable digital excellence.
 StartupTalkyVivek Dev Jacob
FAQs
What are the best AI-powered App Performance Monitoring tools?
Top AI-powered App Performance Monitoring tools in 2025 include Dynatrace, Datadog, New Relic, AppDynamics, SolarWinds APM, Raygun, Quantum Metric, Site24x7, Uptrace, and Fiddler AI.
What features should you look for in an AI-based App Performance Monitoring solution?
Look for features like real-time observability, automated root cause analysis, machine learning-driven anomaly detection, full-stack monitoring, custom dashboards, and integration with cloud platforms and DevOps pipelines.
Original Article
(Disclaimer – This post is auto-fetched from publicly available RSS feeds. Original source: Startuptalky. All rights belong to the respective publisher.)